Analytics Guide
Every ReturnMate analytics tab explained — what it answers, key metrics, plan requirements and CSV exports.
ReturnMate's Analytics page has twelve tabs covering returns, warranty, product failure, shipping cost, staff and process performance. This guide explains what each tab answers and which require the Scale plan.
The basics
- Open Analytics from the main navigation.
- Every tab respects the date range selector; RMA-level charts deep-link into the RMA list pre-filtered.
- Export to CSV exports the current tab's data.
- The Dashboard (home page) complements Analytics with live operational KPIs: open RMAs, pending approval, awaiting receipt/inspection/resolution, quotes pending, SLA on-track/at-risk/breached, and average processing time.
Tabs marked Scale below require the Scale plan or above — on Ops they show an upgrade prompt. See Plans, Billing & Usage Limits.
The twelve tabs
Returns (all plans)
"What's coming back, and why?" Returns over time, returns by SKU, return-type breakdown, return reasons, highest return rates and most-returned SKUs. Your first stop for spotting reason and SKU trends.
Warehouse Mistakes (all plans)
"How often do we ship the wrong thing?" Volume and trend of wrong-item and warehouse-fault returns, top SKUs by mistake count, and a list of recent mistakes. Only populated when returns are categorised with merchant-fault reasons.
Warranty & Repairs (all plans)
"How are warranty claims resolving?" Claim volume, resolution breakdown (repair vs replace vs refund), determinations (warranty approved, out of warranty, customer damage, no fault found) and repair costs.
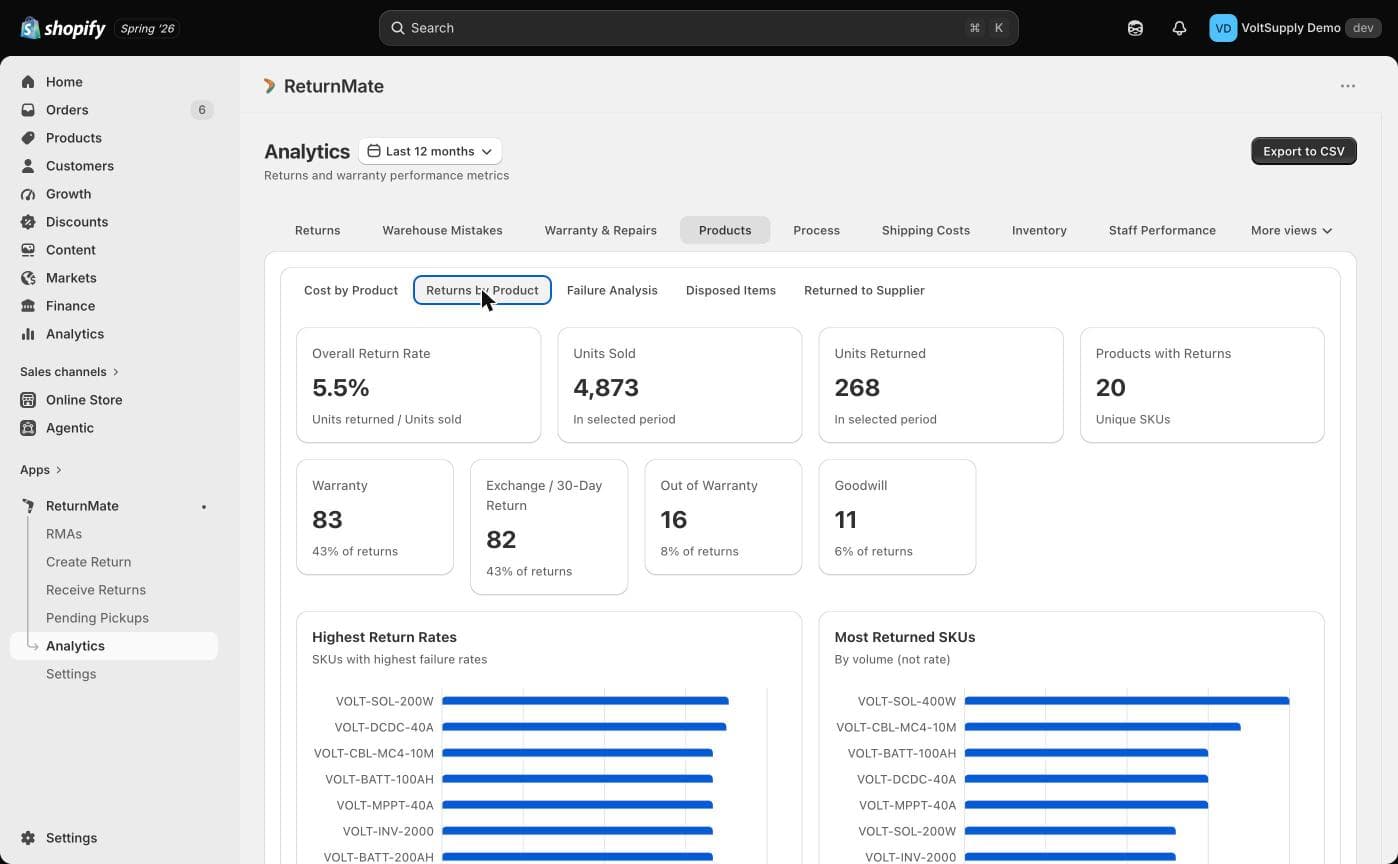
Products (Scale)
"Which products cost us the most?" Cost by product, returns by product, disposed items, returned-to-supplier items, and the full failure analysis suite: product-family failure rates against your amber/red thresholds (Warranty Settings), month-on-month comparison, 6-month block analysis, No-Fault-Found (NFF) analysis and factory-fix tracking. Requires fault codes to be captured at inspection (Faults & Diagnostics Configuration).
Process (Scale)
"Where does time go?" Median time per workflow stage, broken down by assignee and by location — finds your bottleneck stage.
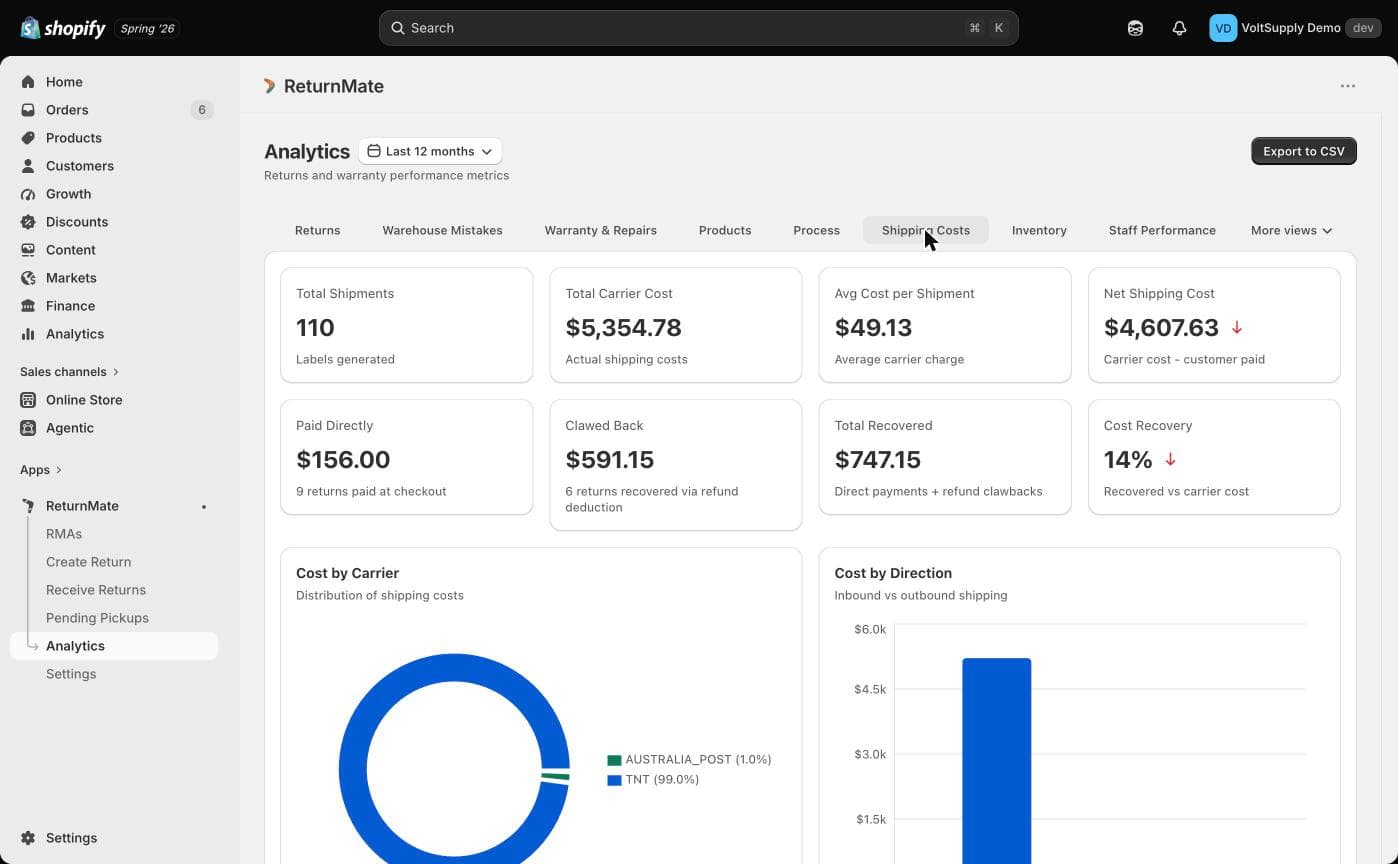
Shipping Costs (Scale)
"What are returns costing in freight?" Cost by carrier, by SKU and by direction (inbound / outbound / inter-store), and customer-paid vs merchant-paid split.
Inventory (Scale)
"What happens to items after return?" Disposition outcomes — restocked, written off, returned to supplier — by reason and SKU, plus parts consumed in repairs.
Staff Performance (Scale)
"Who's processing what, how fast?" Per-user summary, approvals by user, RMAs processed, average processing time, and SLA compliance by staff member. Requires RMAs to be assigned.
Staff Activity (Scale)
"Where is labour going?" Hours logged, labour cost by staff member (using your configured hourly rate) and activity breakdown — driven by the labour-time entries staff log on RMA notes.
Inspections (Scale)
"Is inspection keeping up?" Inspector performance, SLA breach percentage by inspector, and inspection backlog by age.
Stale RMAs (all plans)
"What's stuck?" Open RMAs grouped by age so nothing quietly rots in a queue.
Product Report (all plans)
"Which products fault, and what parts do they consume?" Top products with faults, most-used repair parts, and parts consumed by product.
Why a chart might be empty
- No data in the selected period — widen the date range.
- Faults/failure charts empty — fault codes aren't being captured at inspection, or SKUs aren't mapped to product families.
- Staff charts empty — RMAs aren't being assigned, or no labour time is logged.
- Warehouse Mistakes empty — no merchant-fault reasons recorded (that's good news).
- Upgrade prompt instead of data — the tab requires Scale.
What Analytics does not include
There is no custom report builder, no scheduled/emailed reports, and no reporting API. Exports are on-demand CSV per tab.